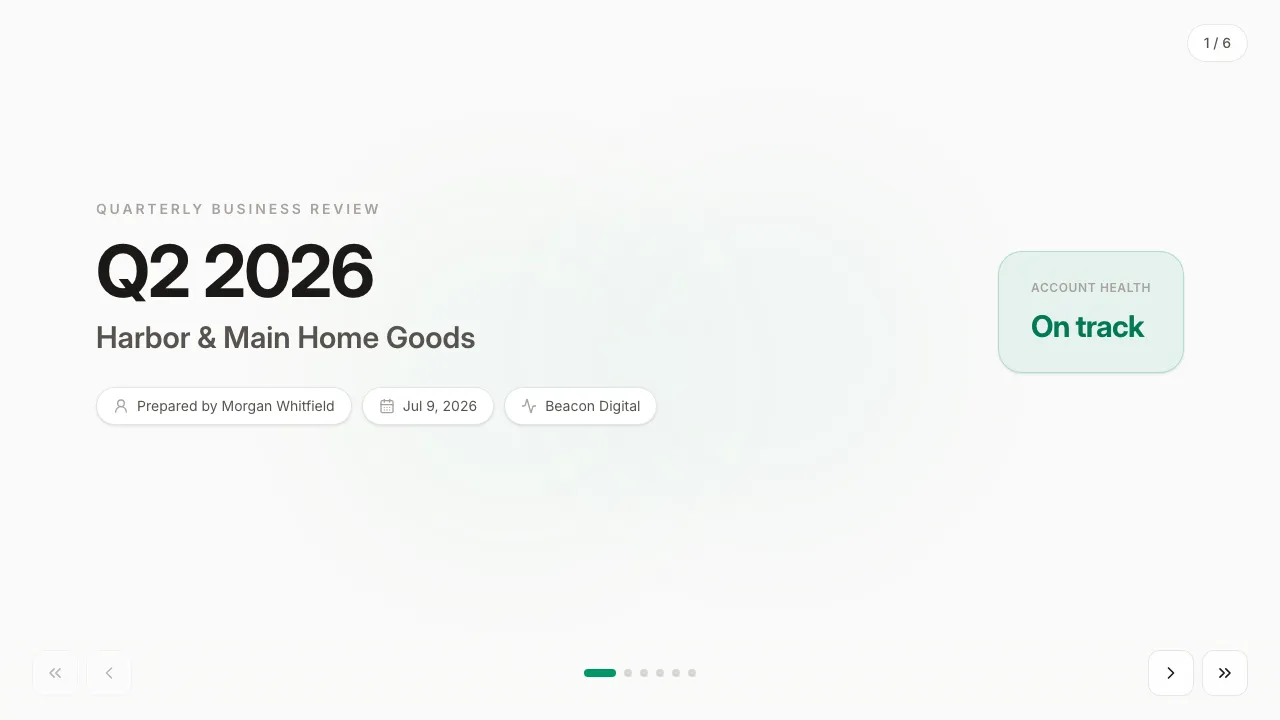
Quarterly business review
Data-forward QBR: KPI grid, trend chart, wins and risks, next-quarter plan.
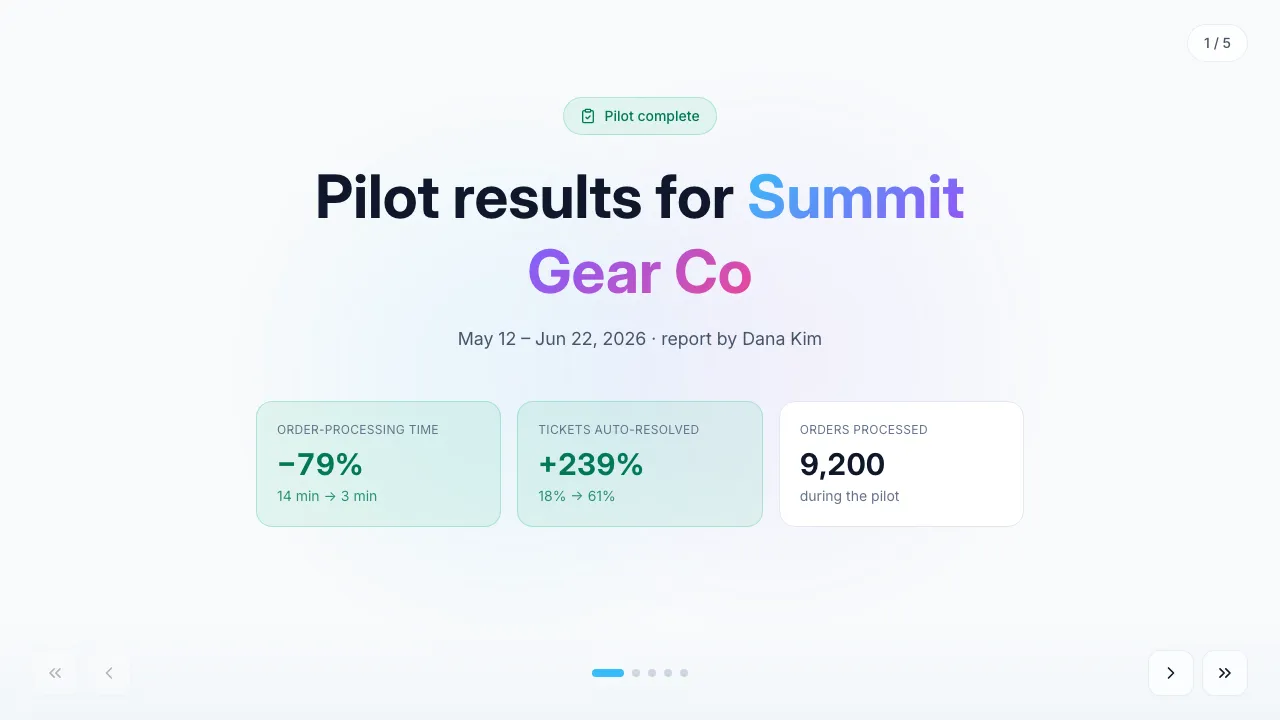
The report that closes a pilot and opens the full contract: before/after metrics as live fields, the trend as a chart, the money in dollars, and the rollout plan — with the final numbers saved to the client’s profile.
For SaaS & tech · IT services · Consulting · Customer success · Sales
Engraving — copperplate engraving, indigo ink on cream laid paper, Prata display type.
Filled in seconds — by form, from a call transcript, through the API or by one sentence to your agent. Filling fields uses no AI credits.
Live elements, saved answers and view tracking belong to the web link; the PDF and PowerPoint exports carry the content.
Always included: open and view-time tracking per link, instant notifications, client memory, editing after sending — and PDF or editable PowerPoint export when a file is required.
Open it in Naimi Studio and tell the AI what to change — your company, your services, your prices — or clone the free kit and hand the folder to Claude Code, Cursor or Codex.
Fill the fields for a real client the way the example was filled for Summit Gear Co: a short form in the app, a call transcript for your agent, or one API call. No AI credits for this step.
The client opens it without a login. You see the open, the time spent and every choice they made — or export a PDF or an editable PowerPoint when a file is required.
Because pilot numbers get challenged in the meeting. Change the input in front of the client and the trend and dollar impact follow; the values you end on are saved.
Yes. It is a web link; opens and view time are reported to you. Export a PDF when procurement asks for a file.
The metric names and the dollar formula are template content — Studio or your agent swaps them for your pilot’s KPIs.
Data-forward QBR: KPI grid, trend chart, wins and risks, next-quarter plan.
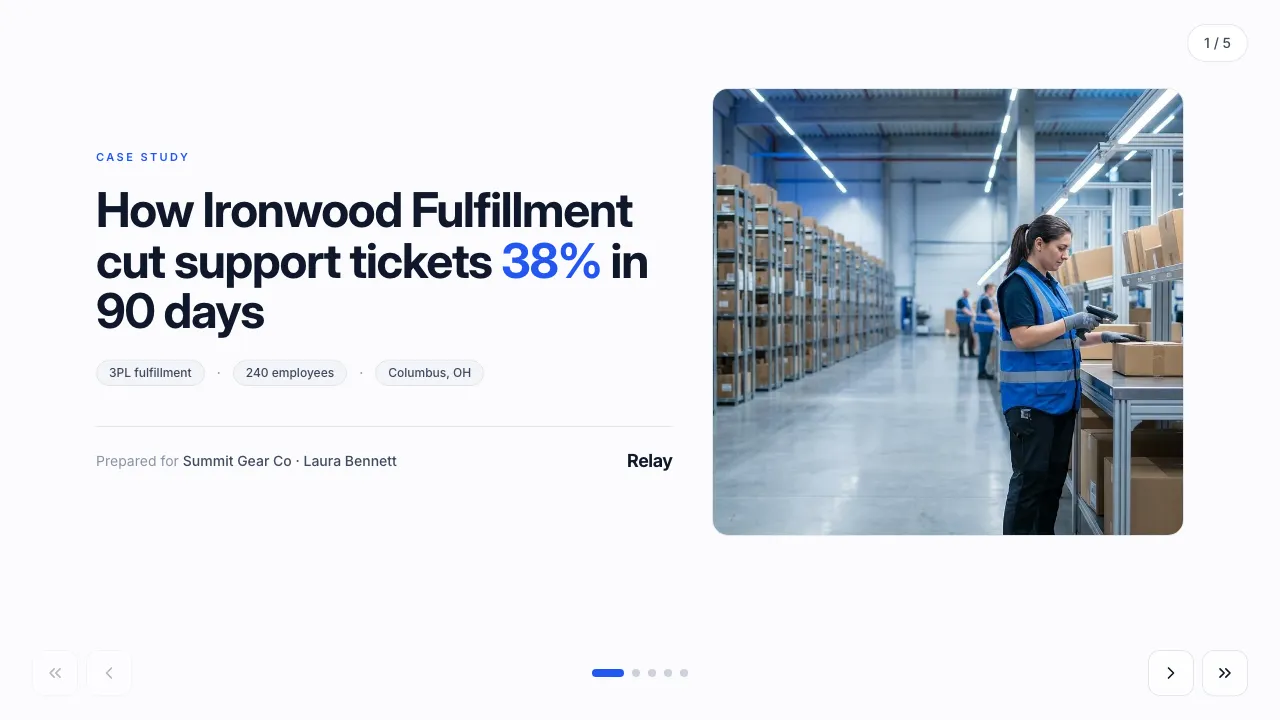
A customer-success story with a personalized projection of the client’s own numbers.
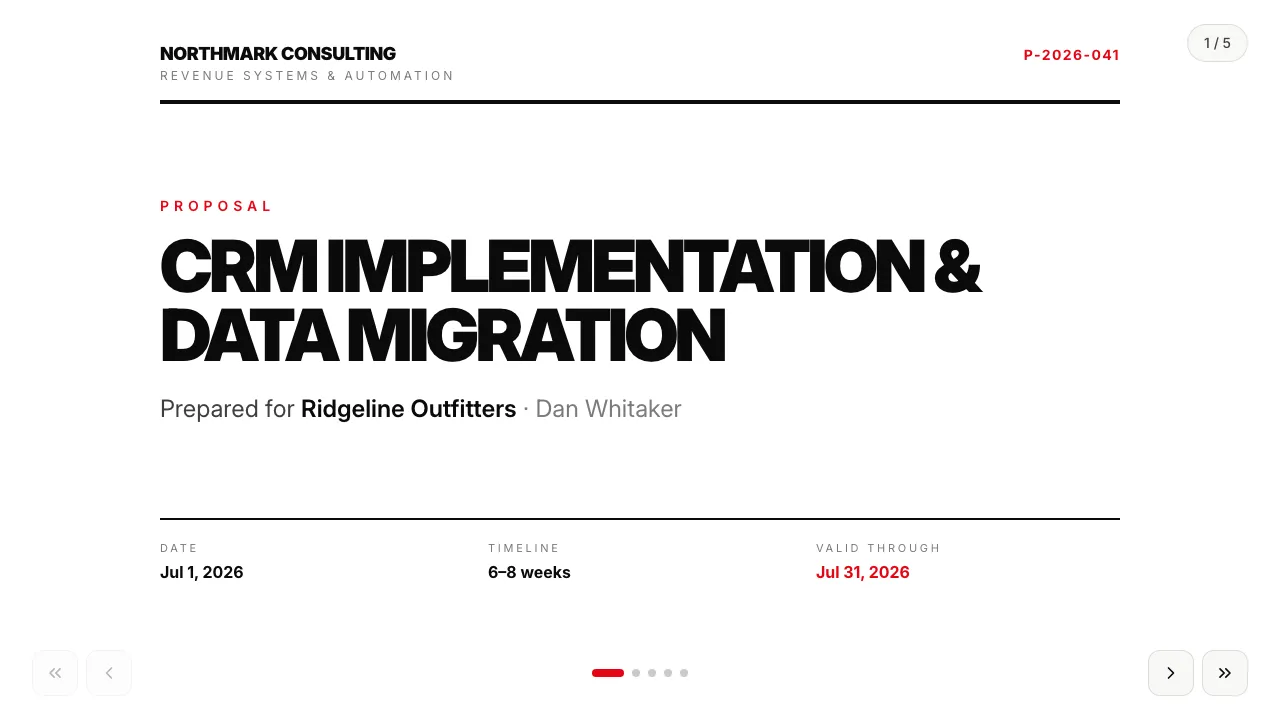
Universal service proposal in a Swiss typographic style: staged pricing and terms.
Change anything in Naimi Studio or with your own agent, then fill the client’s fields. Free plan, no credit card.
4.7/5 · 500+ customers free plan · no credit card · cancel anytime